Industry Trend Report|Global Renewable Energy Review 2022
2022Global Renewable Energy Market Review by Region
Covid-19 epidemic ravaged the world prompted governments to take process blocking measures, not only so that renewable energy with components of the raw material prices soared and increase the cost of setting up, but also due to the lack of labor to delay the process of setting up, but fortunately countries actively promote energy reduction and carbon reduction policies, coupled with the fossil energy prices continue to rise from 2021, but instead of incentives for the development of renewable energy, according to the International Energy Agency (IEA) released "Renewable Energy Market Outlook for 2022 and 2023" report pointed out that in 2021 the global renewable energy power additions amounted to 295 GW, representing 6% of the global power growth over 2020. Renewable Energy Market Outlook for 2022 and 2023" report pointed out that in 2021, the global renewable energy power new setup amounted to 295 GW, an increase of 6% compared with 2020, accounting for 84% of the global power equipment new additions, while the global renewable energy power cumulative setup was 3,146 GW, an annual increase of 10.7%. In 2021, China's cumulative capacity will be the first to exceed 1 TW, and 22 other countries will have a cumulative capacity of more than 10 GW. The top five installations, including China, the United States, Brazil, India, Germany, and the United States, will have a cumulative capacity of more than 10 GW. China, the United States, Brazil, India, Germany and other top five installation countries accounted for a total of 71%. Figure 1 is the distribution of the proportion of primary energy use of renewable energy by country in 2021, more than 50% above only Scandinavian Norway, Sweden, Iceland, and the United States, Germany, China, Japan and other major renewable energy installation countries accounted for the proportion of between 10% ~ 20%.
歐洲再生能源設置量多數來自於太陽光電,占比達六成,主要受益於西班牙、法國、波蘭和德國積極辦理大型地面電廠專案招標與持續實施小型屋頂系統補貼措施。
美國再生能源市場驅動力主要來自於聯邦政府實施的生產稅賦抵減(PTC)與投資稅賦抵減(ITC)優惠,2021年陸域風電的生產稅賦抵減終止,使得新增設置量年減25%,但仍享有投資稅賦抵減的太陽光電市場則持續擴張新增26.9 GW。
印度許多再生能源專案在2020年為因應Covid-19疫情而實施的封鎖措施造成拖延,不過於2021年已相繼完工發電;加上新的獎勵政策帶動分散式系統設置量快速成長,再生能源新增設置量是2020年的兩倍。
南非的太陽光電與風力發電專案陸續開始商轉,讓2021年非洲再生能源市場恢復增長。
越南由於豐厚補貼的FIT制度而掀起太陽光電搶裝潮,讓當年度新增設置量高達4.5 GW,之後市場便快速退燒,2020至2021年市場規模僅有2019年的一半,導致2021年東南亞地區再生能源新增設置年減40%。
圖一、2021年各國再生能源占初級能源使用比例分布
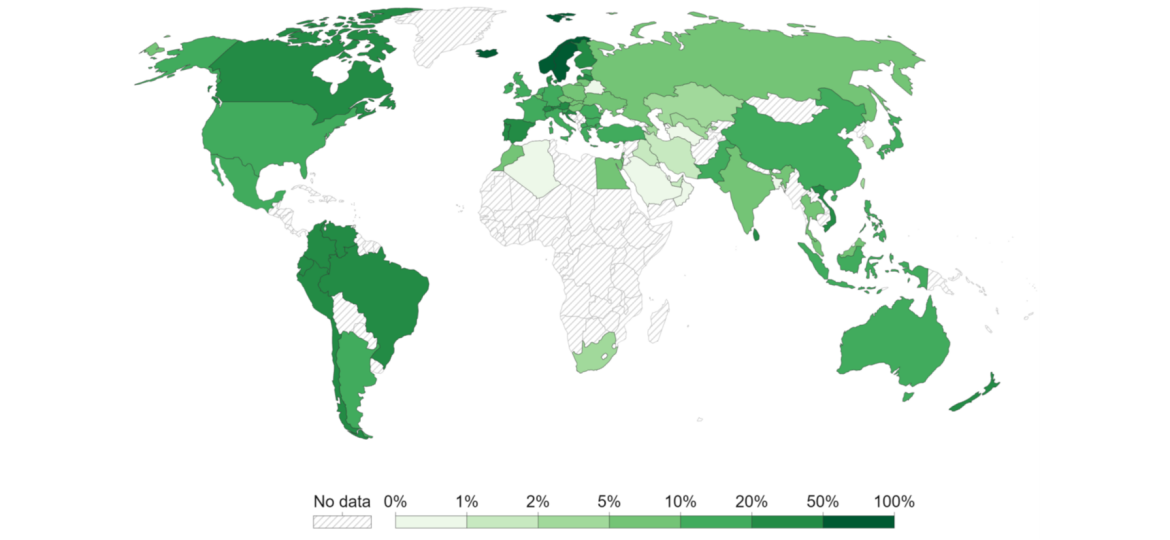
資料來源 : Our World in Data
再生能源裝設成本提高,太陽能仍是投資焦點
目前全球再生能源電力市場兩大主力來自發電成本較的太陽光電與風力發電,但從2021年起全球原物料價格出現狂飆狀況,到2022底全球多晶矽價格已回到2012年的水準(較2020年成長500%),鋼價增加50%,銅價增長70%、鋁價成長一倍,加上運費上漲近五倍,導致太陽光電與風力發電成本反轉向上。預估2022年太陽光電地面電廠與陸域風電設置成本將提高15%~25%,如圖二所示。所幸同時石油與天然氣等石化能源價格亦發生飆漲情況,故成本上漲並未影響太陽光電與風力發電的市場競爭力。另一方面,自2015年起太陽光電地面電廠的設置成本已經遠低於陸域風電,使其具有最佳的發展前景,是當前再生能源專案投資焦點。
圖二、2015~2023年太陽光電地面電廠與陸域風電設置成本變化
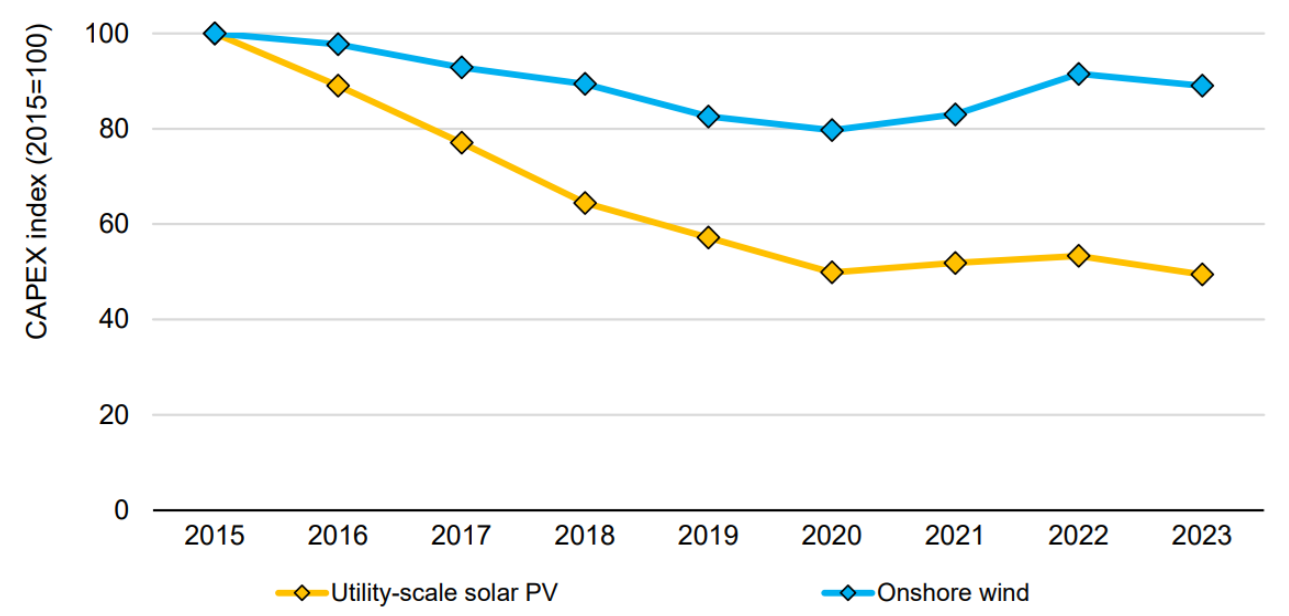
資料來源 : 國際能源署(IEA);智璞產業研究所整理 2022/10
展望2023年成長需要政策持續推動
國際能源署(IEA)的報告指出,預估2022年全球再生能源新增設置量年增長8%,達到319 GW,其中以太陽光電占比60%為最高,2022年新增設置量預計為190 GW,近三分之二設置量由公用事業的大型地面電廠所貢獻,多數安裝於中國與歐盟國家。2022年陸域風電市場恢復增長,新增設置量預估為80 GW,占比位居第二。反倒是離岸風電出現衰退,新增設置量將年減40%,不過仍為2020年的兩倍。該機構評估2023年太陽光電新增設置量可望成長至200 GW(如圖三),但由於水力發電安裝量最大的中國商轉專案數較少而使全球新增設置量年減40%,加上風力發電、生質能增長幅度低,故除非設置大國實施更優惠的獎勵政策,否則2023年全球再生能源新增設置量將與2022年相當。
圖三、2017~2023年全球再生能源新增設置量變化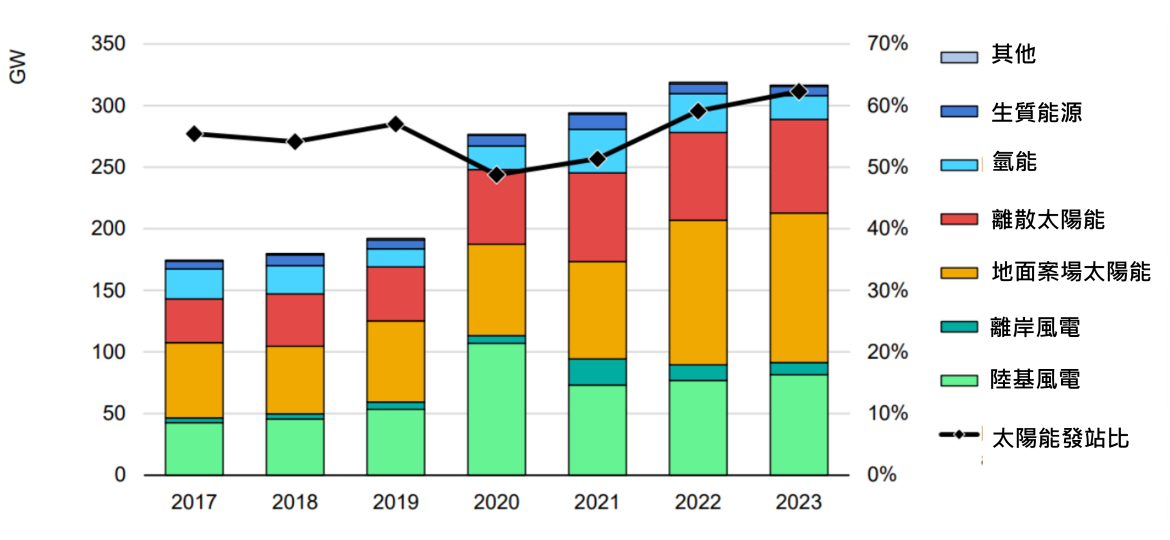
資料來源 : 國際能源署(IEA);智璞產業趨勢研究所整理 2022/10
You may have interesting articles:PV Industry Trend Report|Photovoltaic Industry Trend(Up)-Renewable Energy and PV Market Trend
-For more information, please clickContact Us -
 PV Industry Trend Report|Photovoltaic Industry Trend (Below)_How the U.S. and Taiwan Respond to the Expansion of China's PV Industry
 Corporate News|Highlights of Delta's (2308) Q3 2022 Press Conference